
@Insights answers from your Library, the web, or both. @Data answers with figures from the datasets assigned to your workspace. Both open an output that collects the whole conversation.
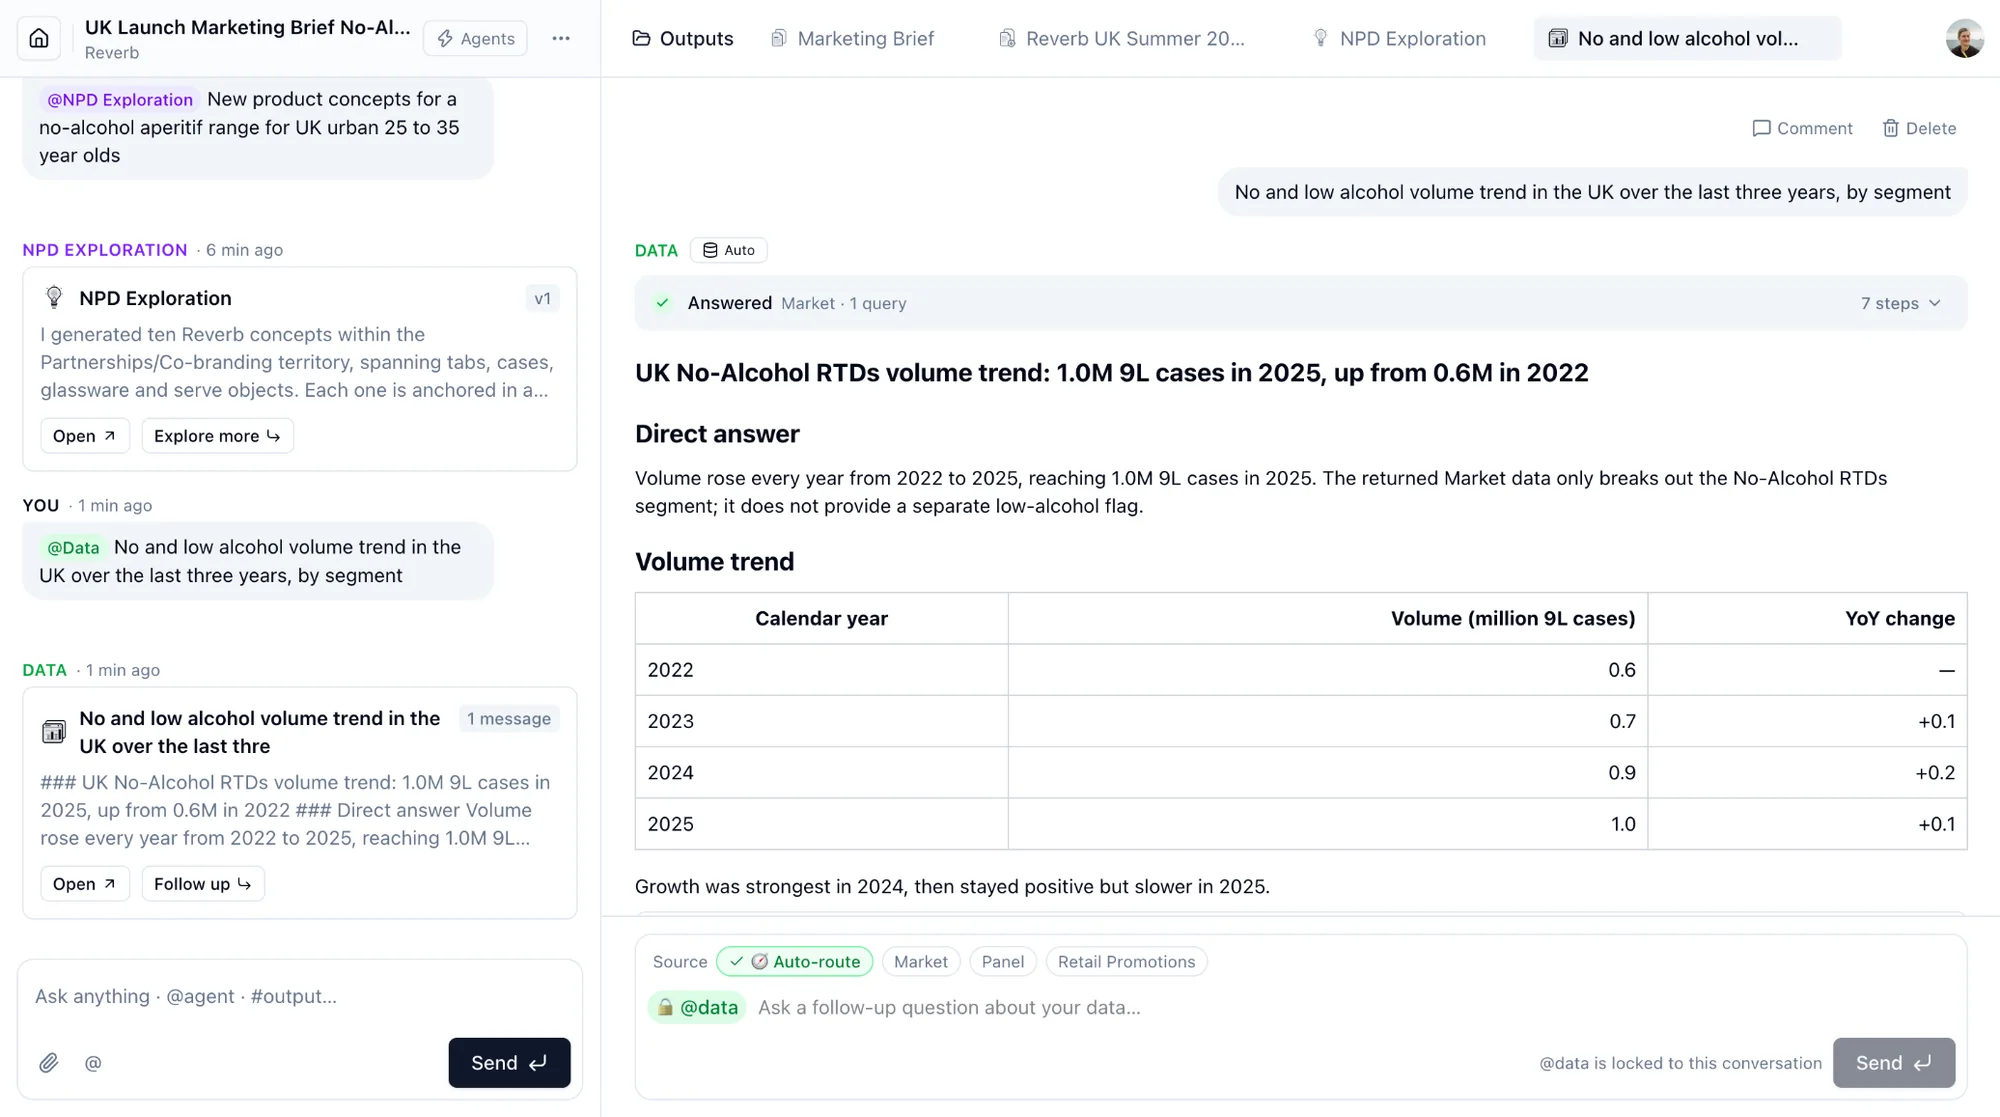
Asking. Select the agent, choose the source if you want, type the question, press Enter. Questions with a market, a period and a metric work best: "Gin volume trend in the UK, last three years".
Follow-ups. Each answer has a follow-up box of its own, locked to that agent. Ask about the previous answer, "which hypotheses did you use?", "show that as a table", "what is the gap between the first two?", and the agent answers from the results it already has. Refine, "same but 2023", "add Carrefour", and it re-queries only what changed.
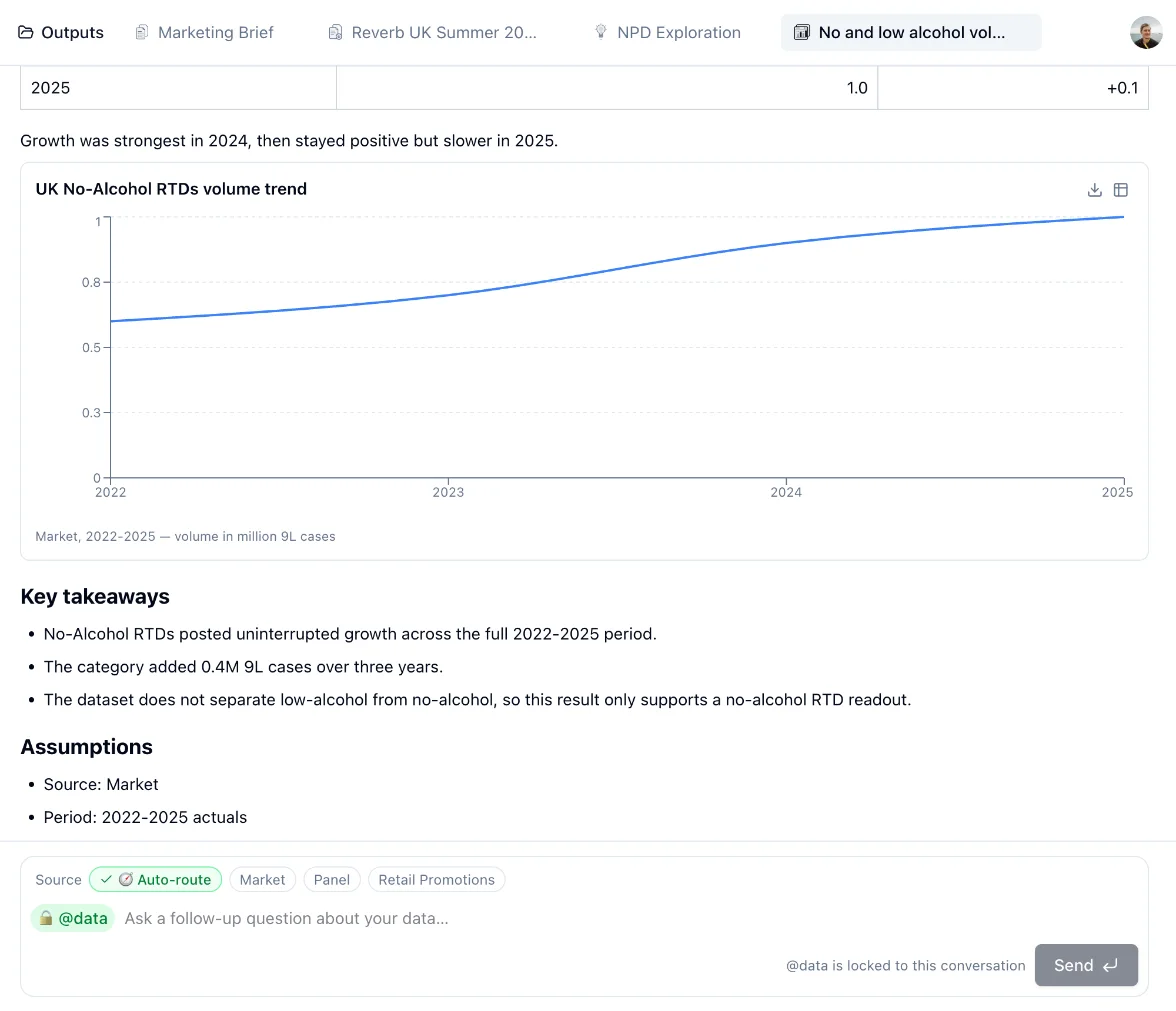
What a Data answer shows. The datasets used, a reasoning row you can expand with every step and the SQL that ran, the answer with charts, and an Assumptions section. Charts can be copied as an image; their data can be downloaded as CSV.
What an Insights answer shows. The synthesis with citations and a Sources list that opens each document at the cited page.
Limits. These agents read no attachments and no linked threads. Data can only answer about the markets and periods its datasets cover, and uses at most three datasets per question.